WAFER STUDIO
Wafer Map Software
How do you turn measured value into added value? Waferstudio delivers at-a-glance solutions to the biggest challenges facing all participants in the semiconductor industry today (wafer and chip manufacturers, the solar industry, and reclaimers): customizable, visualization and data analysis of the entire production process, convenient merging of measurement results from multiple applications. See and understand your data at first sight.
- 3D and 2D data analysis and visualization
- Processing of all common substrate shapes (round, square etc)
- 7 different Interpolation methods and powerful 3D engine
- Can be used on different measurement devices, regardless of manufacturer
- Easy data import via drag & drop
- Lots of analysis functions: Site TIR calculations, 2D cut tool, contour lines, etc.
VISUALIZATION
A glance worth a thousand words
Your metrology systems and gauges provide the numbers. Waferstudio develops the overview, insight and opens up new perspectives from this. For your production chain, efficiency and yield and quality. Especially in one of the most demanding segments of modern industry, Waferstudio delivers some crucial competitive advantages:
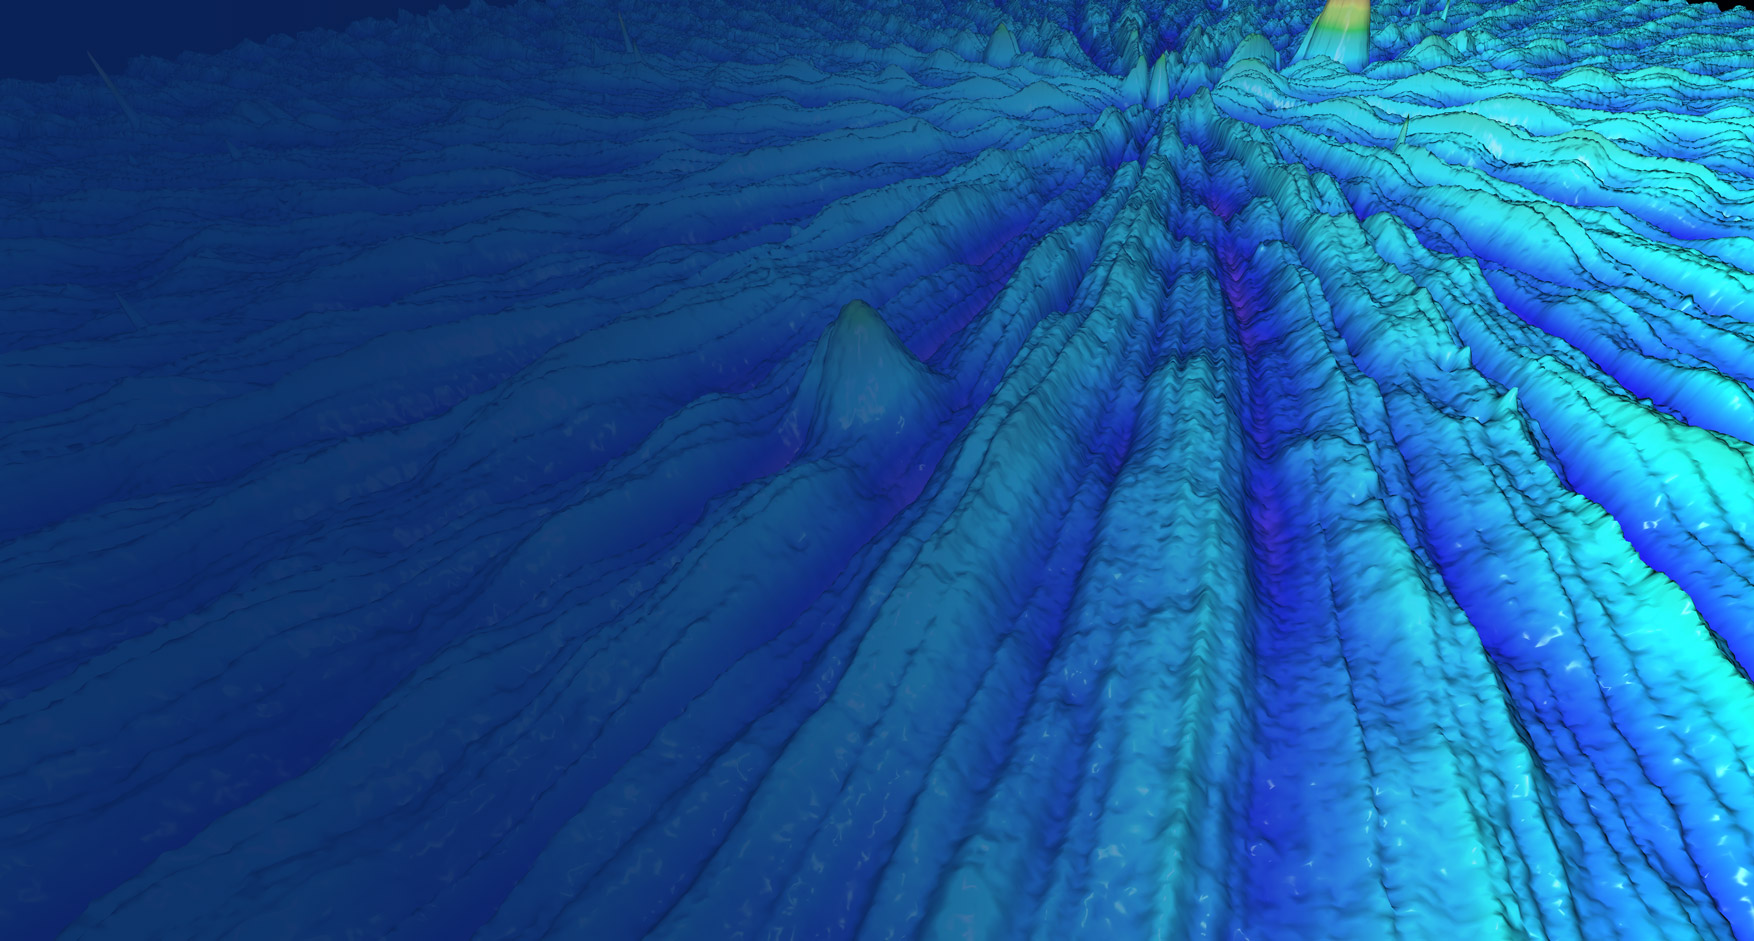
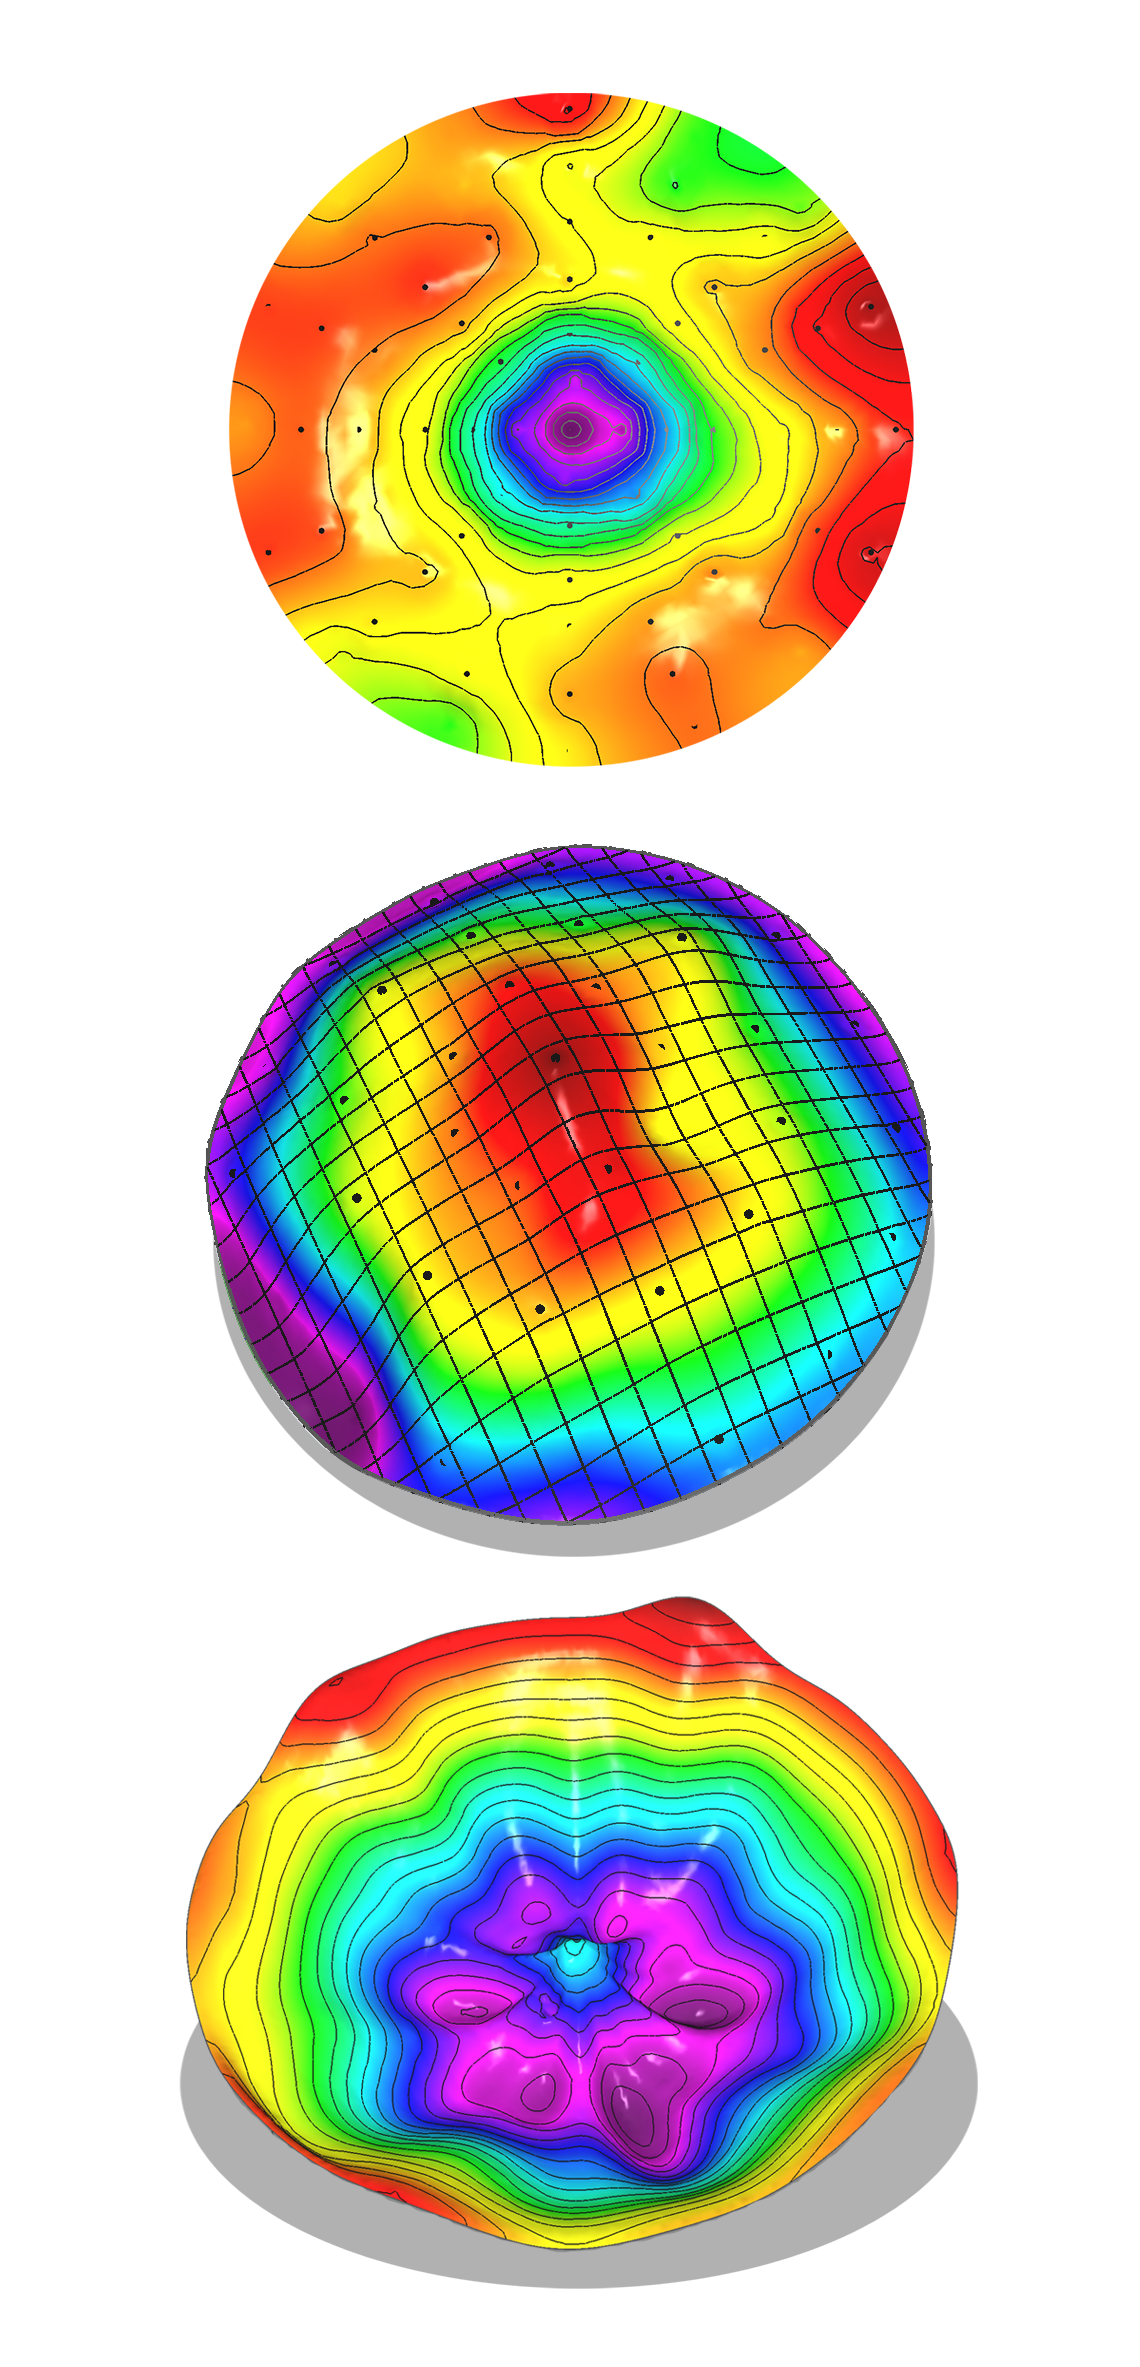
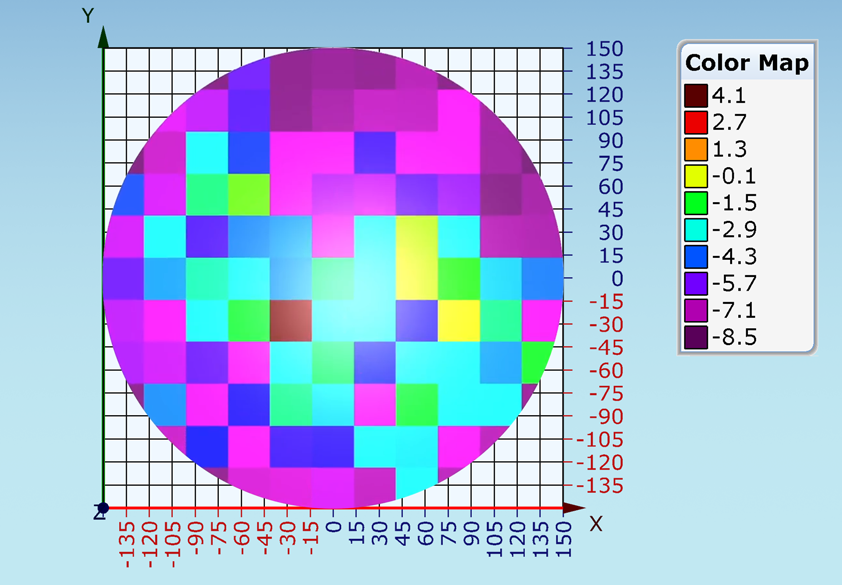
- 7 different interpolation methods: The interpolation method decides how realistically the visualization depicts the previous process step. And thus allows to optimize the process. Therefore, Waferstudio offers seven different interpolation methods (most software solutions offer a maximum of 2). The pykophylatic interpolation developed by E+H is specially adapted to the requirements of wafer production. The normalized and customizable full rainbow color scale allows intuitive estimation of height.
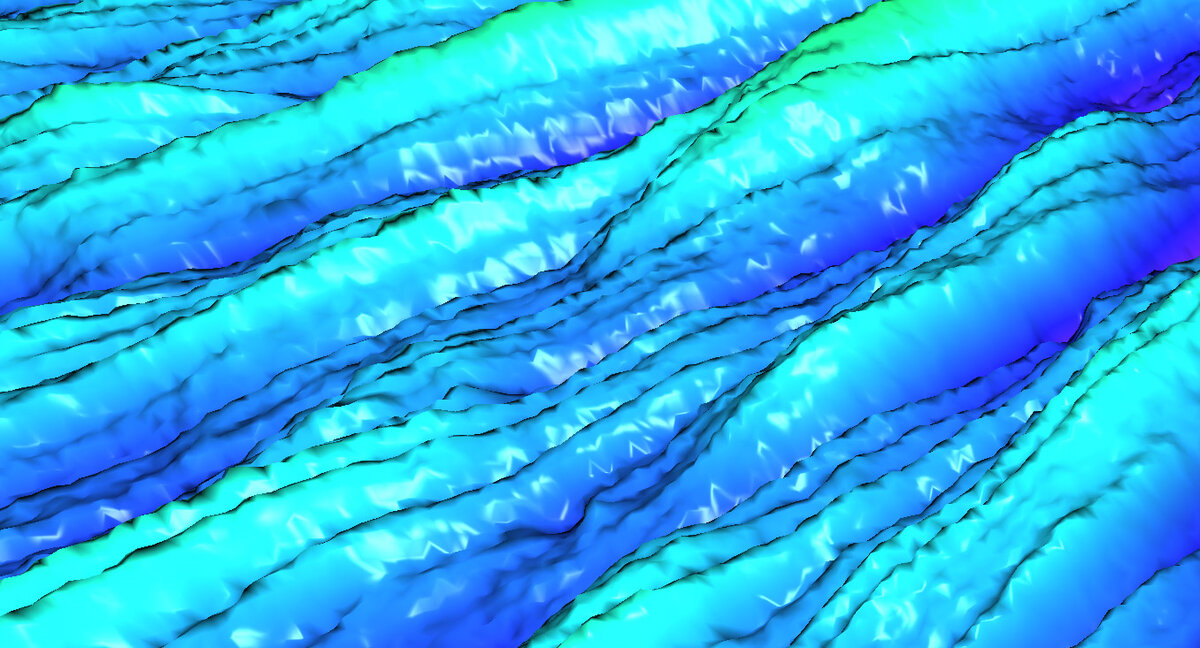
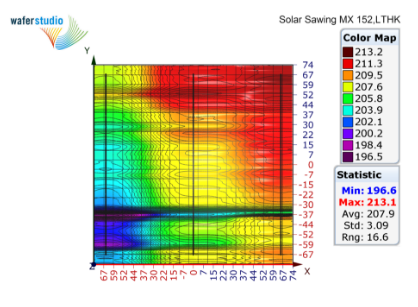
- Silhouette: Strong contrasts allow deformations to be recognized at first glance and give a realistic image of the substrate.
- Shading technology: Through shading, the human eye is accustomed to detecting topographical differences in a minimum of time. Our shading technology has therefore been developed to make even the smallest defects visible.
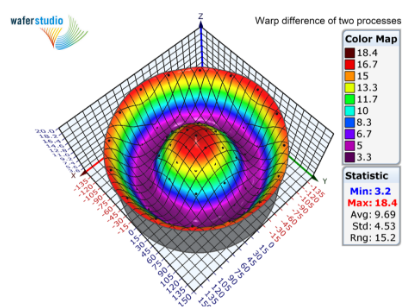
- Light effects: The light effects allow an intuitive perception of the surface texture.
DATA ANALYSIS
Data with impact
You want software that not only processes data, but also enables solutions for complex challenges? We developed Waferstudio specifically for optimizing your processes, and so the analysis functions can be used for a variety of individual tasks. Among many others, these are for example:
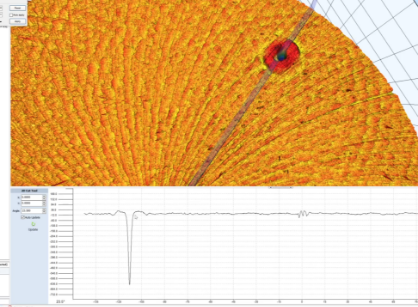
- Site TIR (Total Indicator Reading): The Site TIR value can be more relevant than the Global TIR value for submicron geometry measurement. Waferstudio maps individual Site TIR measurements according to your needs.
- 2D cut function: If, for example, dimples and defects need to be determined more precisely, Waferstudio’s 2D cross-section function is suitable for this purpose.
- Measure Local Standard Deviation: This function makes it possible to quickly and easily determine standard deviations.
- Measurement Comparison: A fundamental problem in process control is comparing measurement results from completely different tools. Waferstudio’s measurement comparison feature allows you to get a perfect comparison overview in just a few steps, even for completely different measurement methods.
CORE FUNCTIONS
Thoughtful at the core
The workflows in the automated wafer fab, RnD or engineering teams, are already complex enough. That’s why our Waferstudio system relies on straightforward, intuitive basic functions that enable your team to work with it immediately without training.
- Import and export: Data import works simply via drag and drop. Waferstudio evaluates the files and automatically selects a suitable import filter. Waferstudio analyzes imported 3D data and matches coordinates to the most common round and square substrate types.
- Real-time calculation: The powerful Waferstudio engine calculates your measurement results for all common wafer geometry characteristics in the minimum amount of time.
- Data editing: Waferstudio offers a wide range of editing options and environments. For example, you can import recurring measurement values, extract data, set standards, etc.
- Workspaces: You can organize Waferstudio into your own „workspaces“, which are mapped in a clear tree structure. Furthermore, all processed data can be exported from the workspaces in any form.
- Additional functions: Our sophisticated special functions have been developed over many years of cooperation with our customers. Use this specific know-how for your processes!
Our tools
CUSTOMER TESTIMONIALS
“Integration with IT is important. There are not so many companies that can do what E+H can offer here!”
Customer · From: E+H customer & partner survey 2021
WHICH SOFTWARE
fits my needs?
You have questions, wishes or an order?
We will be happy to consult you personally.
